ผลต่างระหว่างรุ่นของ "Sgt/eigen1"
ไปยังการนำทาง
ไปยังการค้นหา
Jittat (คุย | มีส่วนร่วม) |
Supachawal (คุย | มีส่วนร่วม) |
||
| (ไม่แสดง 17 รุ่นระหว่างกลางโดยผู้ใช้ 6 คน) | |||
| แถว 1: | แถว 1: | ||
| + | <noinclude>{{Sgt/เนื้อหา}}</noinclude> | ||
| + | |||
== โค้ดตัวอย่าง == | == โค้ดตัวอย่าง == | ||
| แถว 8: | แถว 10: | ||
** main.py: โปรแกรมหลัก | ** main.py: โปรแกรมหลัก | ||
| − | === grpplot.plot === | + | === ฟังก์ชัน grpplot.plot === |
ฟังก์ชัน <tt>grpplot.plot(n, adjmat, px, py)</tt> จะวาดกราฟ n โหนด ตาม adjacency matrix adjmat โดยใช้พิกัดจาก px และ py | ฟังก์ชัน <tt>grpplot.plot(n, adjmat, px, py)</tt> จะวาดกราฟ n โหนด ตาม adjacency matrix adjmat โดยใช้พิกัดจาก px และ py | ||
| แถว 14: | แถว 16: | ||
การปรับแก้การแสดงผล: | การปรับแก้การแสดงผล: | ||
| − | * | + | * สามารถปรับการแสดงโหนดโดยดูจาก [http://matplotlib.org/api/pyplot_api.html#matplotlib.pyplot.scatter เอกสารฟังก์ชัน scatter] |
| − | * | + | * สามารถแก้ไขรูปแบบเส้นโดยดูจาก [http://matplotlib.org/api/collections_api.html#matplotlib.collections.LineCollection วิธีการเพิ่มเส้นในการ plot โดยใช้ LineCollection] |
| + | |||
| + | === โปรแกรมหลัก main.py พร้อมคำอธิบาย === | ||
| + | |||
| + | <syntaxhighlight lang="python"> | ||
| + | def main(): | ||
| + | # สร้าง adjacency list ของกราฟ | ||
| + | n = 100 | ||
| + | #adjlist = gen_line(n) | ||
| + | adjlist = gen_random(n,500) | ||
| + | |||
| + | # สร้าง laplacian ของกราฟ | ||
| + | a = adjmat(n,adjlist) | ||
| + | d = degmat(n,adjlist) | ||
| + | la = d - a | ||
| + | |||
| + | # คำนวณ eigenvectors, eigenvalues แต่ผลจาก eig ไม่เรียง เลยจับมาเรียงเองด้วย sort_eig | ||
| + | w,v = eig(la) | ||
| + | w,v = sort_eig(w,v,n) | ||
| + | print w | ||
| + | |||
| + | # eigenvectors ของ $\lambda_2$ และ $\lambda_3$ | ||
| + | e2 = v[1] | ||
| + | e3 = v[2] | ||
| + | |||
| + | # แกน x เอามาจาก eigenvectors, แกน y สุ่ม | ||
| + | px = [e2[i,0] for i in range(n)] | ||
| + | py = [random() for i in range(n)] | ||
| + | |||
| + | plot(n,a,px,py) | ||
| + | raw_input() | ||
| + | </syntaxhighlight> | ||
| + | |||
| + | == การทดลอง Graph drawing == | ||
| + | |||
| + | ทดลองใส่กราฟในรูปแบบต่าง ๆ เช่น tree, cycle, complete graphs, grids เป็นต้น แล้ววาดโดยใช้ eigenvector ที่สองและสาม | ||
| + | |||
| + | <gallery class="center" widths="320px" heights="240px"> | ||
| + | |||
| + | ไฟล์:Sgt_lab1_k11.png | Complete graph ขนาด 11 โหนด | ||
| + | |||
| + | ไฟล์:Sgt_lab1_bipartite.png | Bipartite graph ขนาด 20 nodes แบ่งเป็น A,B ข้างละ 10 nodes โดยที่ node ใดๆในฝั่ง A เชื่อมไปยังทุก node ในฝั่ง B | ||
| + | |||
| + | ไฟล์:Plot_ring_star_150.png | Graph ที่มี topology เป็น star ผลม ring ขนาด 150 nodes ต่อเป็น 1 cycle ที่ประกอบด้วย 149 nodes และให้ 1 node เชื่อมไปยังทุก node ที่เหลือ | ||
| + | |||
| + | ไฟล์:Graph_plot_grid81x40.png | Graph ที่มี topology เป็น grid ขนาด 81x40 โดยมีการเชื่อมต่อ node เว้น node (function eig(la) ใช้เวลาคำนวณนานประมาณ 10 นาที) | ||
| + | |||
| + | </gallery> | ||
| + | |||
| + | == การทดลอง Graph Partitioning == | ||
| + | === Synthetic data === | ||
| − | == | + | === Image data === |
รุ่นแก้ไขปัจจุบันเมื่อ 19:02, 2 กุมภาพันธ์ 2558
เนื้อหา
โค้ดตัวอย่าง
- โค้ดตัวอย่างอยู่ที่ github
- Modules:
- mat.py: สร้าง adjacency matrix และ degree matrix
- generators.py: สร้าง adjacency list ของ line และ random graph แบบสอง cluster
- grpplot.py ส่วนของการ plot
- main.py: โปรแกรมหลัก
ฟังก์ชัน grpplot.plot
ฟังก์ชัน grpplot.plot(n, adjmat, px, py) จะวาดกราฟ n โหนด ตาม adjacency matrix adjmat โดยใช้พิกัดจาก px และ py
การปรับแก้การแสดงผล:
- สามารถปรับการแสดงโหนดโดยดูจาก เอกสารฟังก์ชัน scatter
- สามารถแก้ไขรูปแบบเส้นโดยดูจาก วิธีการเพิ่มเส้นในการ plot โดยใช้ LineCollection
โปรแกรมหลัก main.py พร้อมคำอธิบาย
def main():
    # สร้าง adjacency list ของกราฟ
    n = 100
    #adjlist = gen_line(n)
    adjlist = gen_random(n,500)

    # สร้าง laplacian ของกราฟ
    a = adjmat(n,adjlist)
    d = degmat(n,adjlist)
    la = d - a

    # คำนวณ eigenvectors, eigenvalues แต่ผลจาก eig ไม่เรียง เลยจับมาเรียงเองด้วย sort_eig
    w,v = eig(la)
    w,v = sort_eig(w,v,n)
    print w

    # eigenvectors ของ $\lambda_2$ และ $\lambda_3$
    e2 = v[1]
    e3 = v[2]

    # แกน x เอามาจาก eigenvectors, แกน y สุ่ม
    px = [e2[i,0] for i in range(n)]
    py = [random() for i in range(n)]

    plot(n,a,px,py)
    raw_input()
การทดลอง Graph drawing
ทดลองใส่กราฟในรูปแบบต่าง ๆ เช่น tree, cycle, complete graphs, grids เป็นต้น แล้ววาดโดยใช้ eigenvector ที่สองและสาม
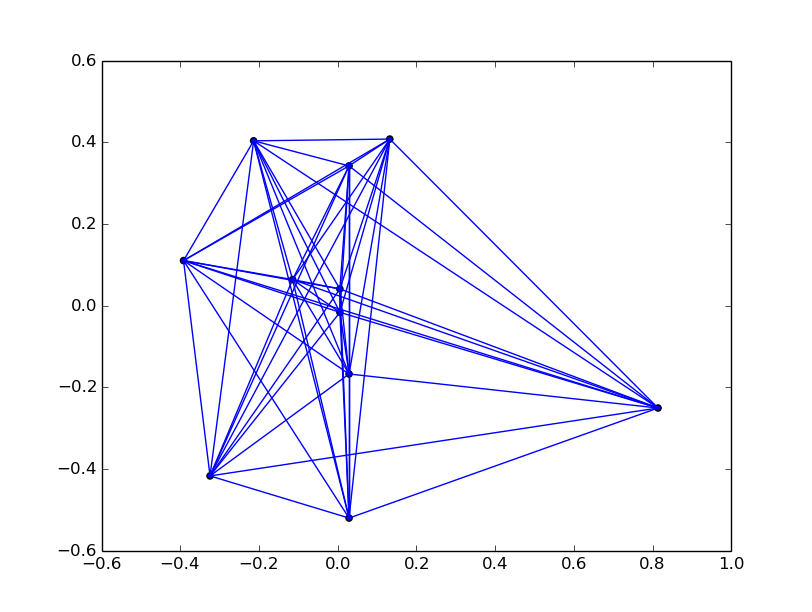
Complete graph ขนาด 11 โหนด
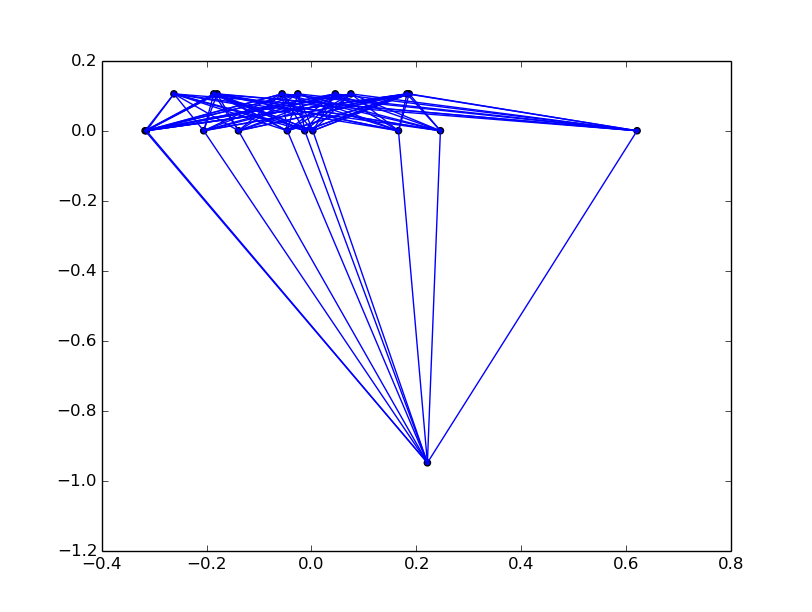
Bipartite graph ขนาด 20 nodes แบ่งเป็น A,B ข้างละ 10 nodes โดยที่ node ใดๆในฝั่ง A เชื่อมไปยังทุก node ในฝั่ง B
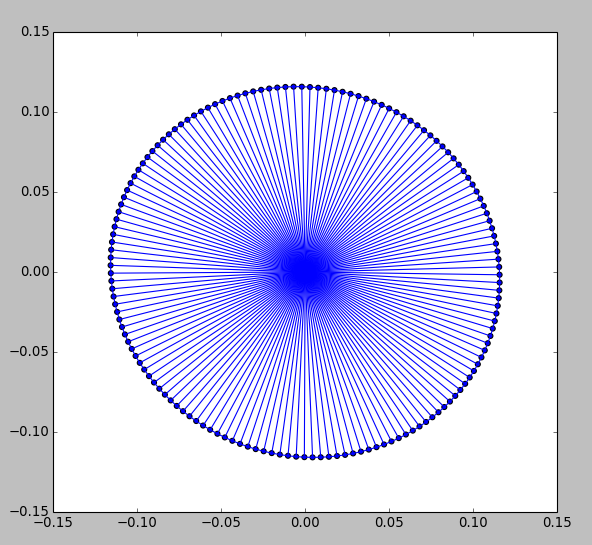
Graph ที่มี topology เป็น star ผลม ring ขนาด 150 nodes ต่อเป็น 1 cycle ที่ประกอบด้วย 149 nodes และให้ 1 node เชื่อมไปยังทุก node ที่เหลือ
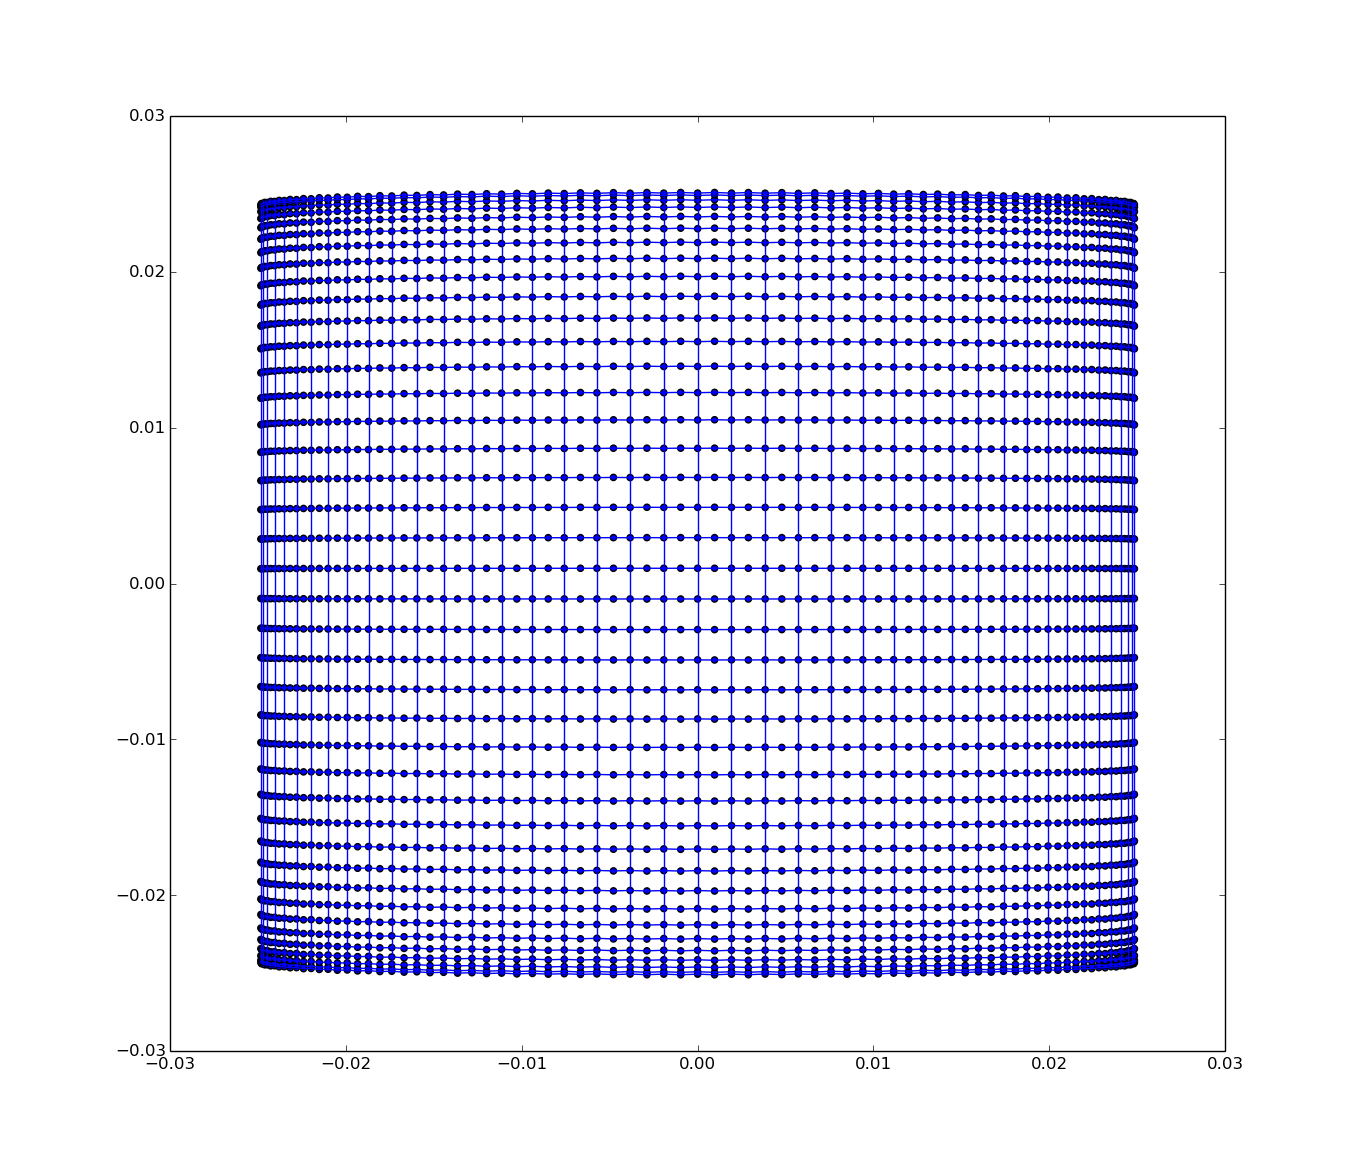
Graph ที่มี topology เป็น grid ขนาด 81x40 โดยมีการเชื่อมต่อ node เว้น node (function eig(la) ใช้เวลาคำนวณนานประมาณ 10 นาที)


